In this screenshot, you can see what the PCC web management interface looks like.
In the upper part are located:
1. The control links panel with the loading window of the PCC logs with the current time.
2. Panel of control buttons for PCC channels on 12V and 220V, with the values of currents and voltage on the batteries.
3. Panel of temperature sensors.
4. Button panel of additional PCC relays.
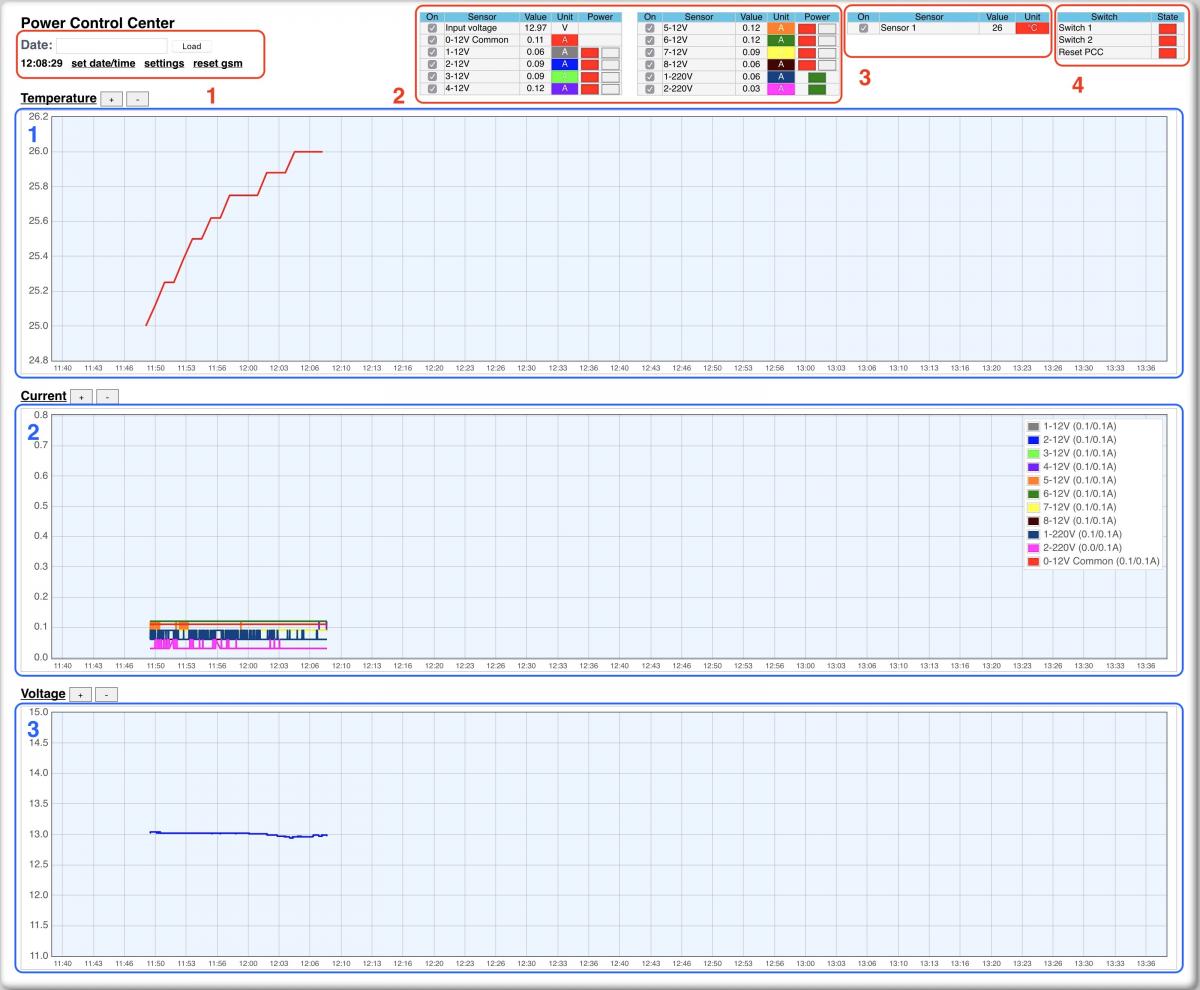
In the lower part are located:
1. Graph of temperature sensors.
2. Graph of current sensors.
3. Voltage sensor graph.
Now, let's go through each block separately:

1. Log loading window for a specific date. In the window you can select the date for which you want to see the logs for all sensors and click the Load button. It should be know that time by date starts at 12:00 of your date and ends at 12:00 next days after your date. This is done so that you can analyze the logs for the whole night in one window.
2. Current time. It is necessary to ensure that it is relevant. In case it differs from the current one, you must use the set date /time link to synchronize time with your computer.
3. Settings link. Opens the page with the PCC settings. Description of this page below.
4. GSM module reset link. If for some reason your PCC has stopped responding to SMS commands, then you can reboot the GSM module with its subsequent reinitialization.

1. On/off representation of the graph of the sensor of the corresponding channel.
2. The name of the sensor/channel. You can edit in the web interface settings.
3. The current sensor value of the corresponding channel.
4. Sensor graph color. You can edit in the web interface settings.
5. On/off the corresponding channel in safe* mode. If the button is red, the channel is off, if the button is green - on.
6. On/off the corresponding channel in unsafe* mode. If the button is transparent, the channel is off; if the button is green - on.
7. On/off channels for ~220/110V. There is no safe functional. If the button is green, the channel is on, if in red - off.
* - What is safe and unsafe mode? When designing the PCC, we decided on each channel 12V to introduce one of the necessary functionality, from our point of view. Namely, the power is turned off on the channel when one or another sensor (contact) is triggered. In order to make it more clear, we give an example from one of our observatories. In the observatory on a mount in extreme positions, magnets with reed switches are installed. When the mount moves beyond the established zones, the reed switches close and the voltage of the mount controller is turned off, preventing breakage of both the mount and all other equipment. Each channel has two pairs of connectors.
One pair is for open sensors (a jumper is installed on it) and the second pair is for short circuits (there is no jumper on it). If necessary, you can connect the appropriate sensors (opening / closing) to enable safe mode on a specific channel.
When the voltage on the channel is turned on with the safe button (left button on each channel), it will appear only under the condition of safe mode for two open / close channels. If you have external sensors connected to this channel and they are in safe mode power is on, if they worked, then there will be no power. If the sensors are not connected, then power will always be supplied.
When you turn on the voltage on the channel with the unsafe button (the right button on each channel), it will appear in any position of the safety sensors. What is this button for? For the example above with the mount, in the event of a safe mode operation and disconnecting the mount power, it is necessary to supply voltage to the mount controller to return it to its working position. We turn on the power of the controller using the unsafe button, look through the webcam at the observatory and move the mount to the working area, followed by synchronization of its location in the sky. After shifting the mounting and turning off the security sensors, turn on the power again with the safe button and turning off the power with the unsafe button. THAT IS ALL! The mount works further in safe mode and in the event of a failure and going beyond the established zones, the power will be turned off again.

1. On/off display of the graph of the sensor of the corresponding temperature sensor.
2. The name of the temperature sensor. You can edit in the web interface settings.
3. The current value of the temperature sensor.
4. The color of the temperature sensor graph. You can edit in the web interface settings.

1. The name of the relay channel. You can edit in the web interface settings.
2. On/off relay channels. If the button is displayed in green, then the channel is on, if in red - off.

At the bottom of all the control panels of the PCC there are three graphs - temperature, current and voltage. Values of the respective sensors. The scale of the graphs can be changed. Each of the graphs has its own buttons for scaling. Horizontal scaling is changed by holding down the Ctrl key and mouse scroll wheels. Additional information on the schedule (tooltip). Minus and poppy values for each chart.

And the last page is the settings page. The screenshot above shows all the fields for configuring the web interface and alerts of the PCC.
1. Link for downloading the local version of the PCC management. In cases where you do not have the ability to connect to the Internet and you need to manage the PCC, the local version is intended. For its operation, it is necessary to fill in the "Table of settings for the local version of the PCC control". Indicate the IP of your PCC and its serial number. You should also consider that you can download the local version of the MCC management only if you have the Internet. Therefore, it must be downloaded in advance, and not at the moment when there is no connection.
2. Temperature sensor setup table. In this table, you must enter the ID and name of the temperature sensors that are connected to the PCC. Graphs of these sensors will be displayed on the control center main page.
3. Table of current sensors settings. In this table, you must specify the channel names of the PCC and, if necessary, disable unused ones. We do not recommend changing the Zero Offset and Sensor Coefficient settings. These are the technological settings that are made when calibrating the current sensors.
4. The average values for all current sensors. The current sensor is digital and the sensor value varies from 0 to 1023. The average value determines the zero current. If you see that when the load is off, the current sensors show overestimated values, then using this setting you can correct them. We recommend that you do this with the relays turned on and the load off. Values without load should beat in the aisles 0.03-0.09A.
5. Voltage sensor setup table. This table adjusts the displayed voltage value on the control page. The minimum voltage value at which the alert will be sent, in the form of SMS, to your phone and the number of SMS in the case of a given alert.

6. Table of settings for the names of additional relays. Everything seems to be clear here. =)
7. Table of settings for the local version of the PCC control. This will indicate the IP address and serial number of the PCC needed to download the local version of the MCC management. This was discussed above.
8. Alert settings table. Two e-mail addresses to which alerts are sent are indicated here. The first is to receive SMS notifications, the second is to receive emails.
9. ACP alerts setting table. Here, the ACP parameters are indicated and here you can copy the tiddler code for the ACP web interface.
10. Button to save the configuration settings of the PCC.
Please note that changing the settings may lead to incorrect operation of the PCC !!!